Visual Modeling and the UML
Last updated: Mar. 8, 2006
Objectives:
After completing this module, you will be able to define visual modeling and discuss its benefits.
Describe the Unified Modeling Language (UML).
Name and describe the UML diagrams that can be modeled in Rational Rose.
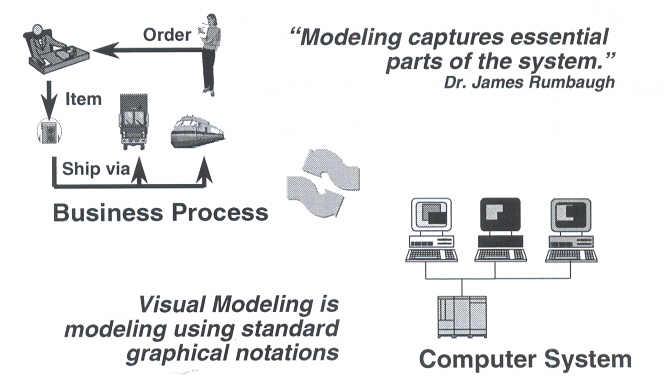
What Is Visual Modeling?
In the world today, we have business processes and computer systems. As software professionals, our challenge lies in mapping the two.
That is where modeling comes in. Modeling involves capturing the important real world "things" and mapping these "things" to computer systems.
To do this, we need a method to show this mapping. This method is visual modeling. Modeling creates a blueprint for the system we want to build, using a standard language that is understood by all. This language is the UML, which is discussed later in this module.
Benefits of Visual Modeling:
Visual Modeling Captures Business Processes:
Most applications are made up of many business processes. Use-case analysis allows us to capture these business processes from a user point of view. In addition, use-case analysis allows us to create clear pathways through the business processes.
Use-case analysis allows the analyst to understand WHAT is to be built, before trying to build the system.

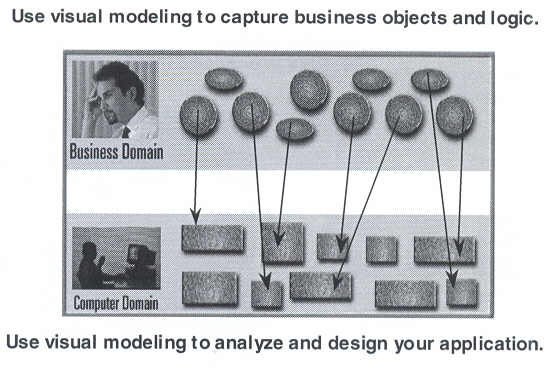
Visual Modeling Is a Communication Tool:
Business analysts and domain experts define requirements. Software architects and developers build systems based on requirements. Typically, they have communication problems due to both different use of terminology and definition of concepts. This is where visual modeling makes a difference.
Visual modeling is used to capture the business world. It is also used to capture and document the computer world. And most important, visual modeling provides a smooth transition between the two different worlds with traceability from the business world to the computer world.
Visual Modeling Manages Complexity:
In an actual development project, systems contain hundreds and even thousands of classes. Having one picture with 3000 classes pasted to a wall in a conference room is not very useful. We need a way to group these classes into meaningful collections.
Visual modeling includes the concept of a package, which is a group of things. By using packages, you can group modeling elements into meaningful collections, thus showing the model at different levels of abstraction to different groups of people.
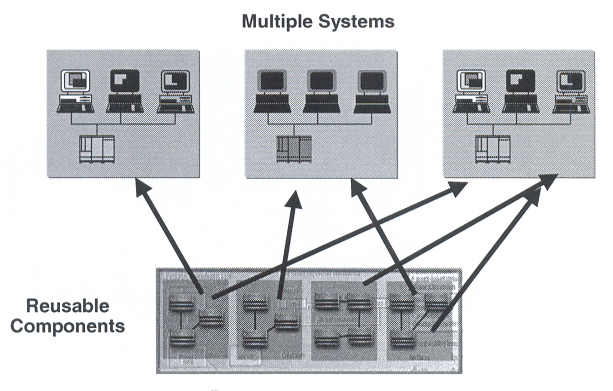
Visual Modeling Promotes Reuse:
There are many forms of reuse─reusing a class, reusing a group of classes or a component, and applying a pattern. No matter the form of reuse used, you reuse more than the code. You reuse all the analysis, design, implementation, test, and documentation that was needed to build the original artifact.
Visual modeling allows you to see what is available from a reuse point of view to determine if, indeed, the artifact may be reused.
What Is the UML?
The UML is the standard language for visualizing, specifying, constructing, and documenting the artifacts of a software-intensive system.
The UML combines the best from
Data modeling
Business modeling
Object modeling
Component modeling
It is a standard language that may be understood by everyone dealing with the project─customers, domain experts, analysts, designers, implementers, testers, trainers, and so on.
The UML may be used with any process. Although, it is generally assumed that the process is architecture centric, use-case driven, iterative, and incremental.
History of the UML:
In the late 1980s and early 1990s there were many different methodologies. Three of the more popular methods were the Booch method by Grady Booch, the OMT method by Jim Rumbaugh, and the OOSE method by Ivar Jacobson.
They spent until June 1996 maturing the Unified Method. In June, the .9 version was published. Here, the name officially changed to UML since it is a language NOT a methodology. It was also during this time that feedback was incorporated from their UML partners─companies like Microsoft, Oracle, IBM to name a few.

UML Concepts:
The UML can be used to support your entire lifecycle. You can:
See the interaction with the outside world in use-case diagrams.
Visualize object interaction in sequence and collaboration diagrams.
Look at the structure of your system by examining class diagrams.
View the system architecture by looking at the defined packages.
Explore the physical nature of your system using component diagrams.
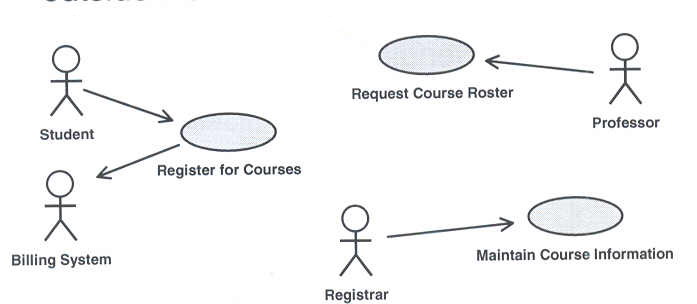
Use-Case Diagram:
A use-case diagram is created to visualize the interaction of your system with the outside world.
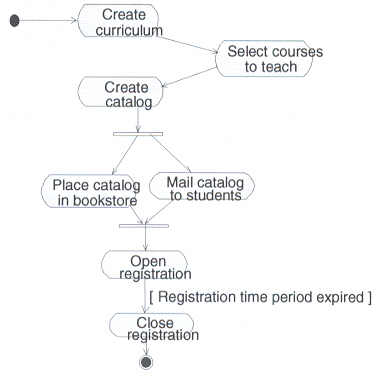
Activity Diagram:
An activity diagram shows the flow of events within our system.
The basic activity for a complete course registration process.
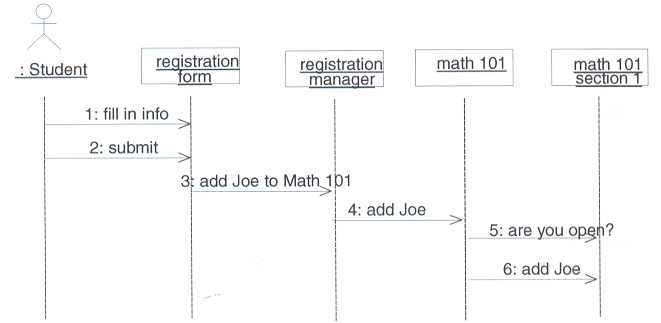
Sequence Diagram:
A scenario may be shown graphically in a sequence diagram. This diagram shows you step by step what must happen to accomplish a piece of functionality in the use case.
You start by identifying the objects in the scenario. Let's look at adding a student to a course offering. A student wants to take Math 101. The scenario is initiated by the student and needs four objects─registration form, registration manager, math 101, and section 1. Next, we identify the object interactions that must occur.
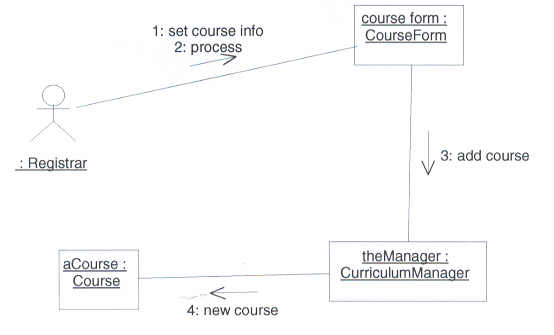
Collaboration Diagram:
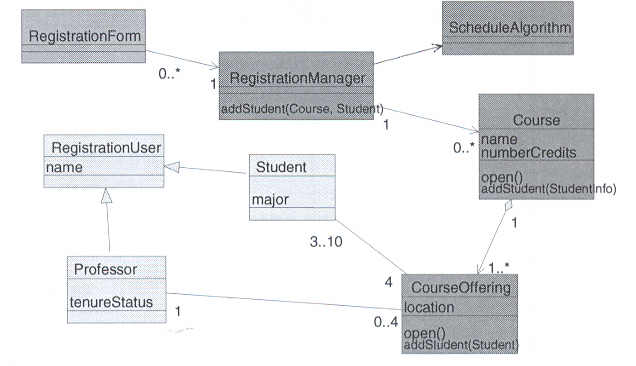
Class Diagram:
Statechart Diagram:

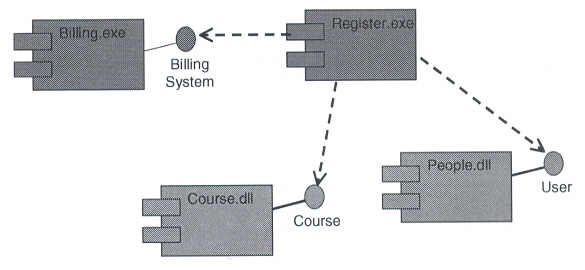
Component Diagram:
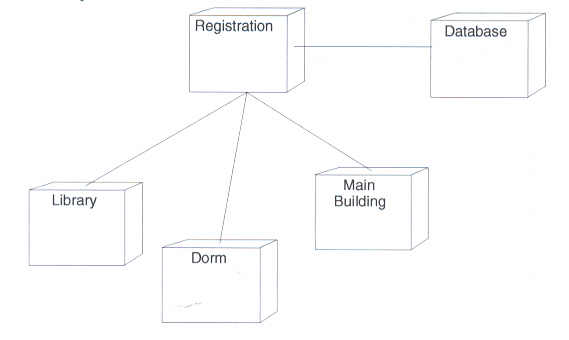
Deployment Diagram:
Extending the UML:
Summary: